Over the decades, many case studies have been conducted using ErgoSuite and it’s predecessor versions with the results being consistently delivered. We’ve included several of them here as emblematic of the solid effects of Office Ergonomics in the computerized workplace:
Case Study – 363,326,775 Observations
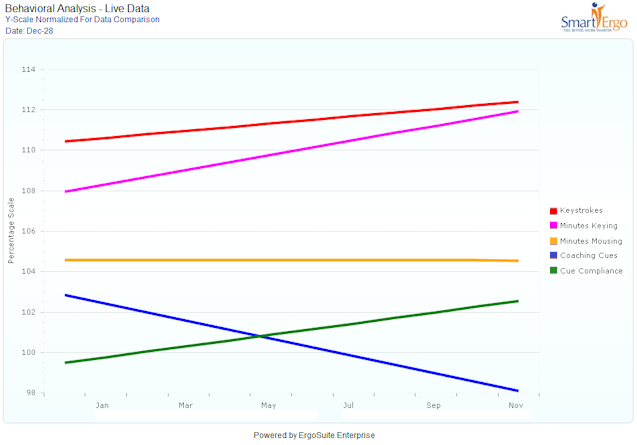
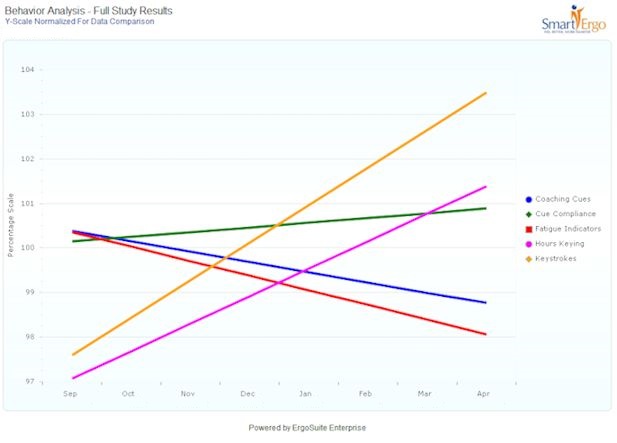
Yet another extensive research project is presented, specifically analyzing 363,326,775 keystrokes and mousing seconds belonging to a large population of employees. Here is live data underlying an ErgoSuite chart analyzing seven month’s usage of ErgoSuite’s Employee Tools by a large population including a diverse spectrum of job functions:

Above, we’re looking at an actual ErgoSuite Enterprise chart where we’ve chosen to view Trend Lines (Least Squares Linear Regression) which model live underlying data. Used throughout data analysis and in mathematics, these lines represent the actual underlying data’s movement over time. Of course, raw data is never as smooth as the trend lines because it ebbs and flows over time traversing seasonality such as reduced activity during holidays, however, the trend is clear and reliable. Linear regression is an invaluable tool widely used for modeling trends from complex data sets. Within this graphical report:
- ErgoSuite is modeling live data specifically examining (1) Keystrokes, (2) Hours Keying, (3) Employee Fatigue, (4) Coaching Cues from ErgoSuite Coach and (5) Cue Compliance which is a measure of an employee’s adherence with coaching cues supporting an organizational best practice.
- These coaching cues are only required when an employee’s “recovery time as a function of duration and repetition” is inadequate (high risk).
- Each metric in the chart is indexed to its initial value, for comparability, showing its trend (growth) over the period. For example, seeing Cue Compliance grow from an index of 100 to 101 simply means its growth has been 1% from its initial monthly value and does not imply that compliance is above 100%.
- In fact, the overall Cue Compliance for this specific population of employees was solidly within the 90%-100% range throughout the period.
- The average number of observations ‘per employee’ underlying ‘each’ trend line is more than 84,000 over the seven month period.
- This employee population spans the spectrum of low, medium and higher computer-usage.
- In addition, we know from other collected live data analyses that when employees develop new good ergonomic behaviors at work, these learned behaviors carry on after work when using the computer at home.
Case Study – 595,260,706 Observations
This study’s data (below), reminds us of an earlier study by a university research team at an Insurance Brokerage Risk Management firm where they measured the impact of an earlier version of ErgoSuite on their employees using computers at least one hour each day.
The company’s Chief Human Resource Officer (CHRO) was surprised and delighted after validating the results of their safety team’s project of seeking ways to empower and protect employees. A later Safety Online article chronicled their project which exceeded maximum expectations for risk reduction and additionally produced a sustained new 13.4% increase in Work Accuracy:
“If anyone had told me that making simple changes to the way people use computers could lead to a 13% improvement, I’d have dismissed it out-of-hand as not credible,” stated LeAnn Orabona, Human Resource Manager, New Century Global Inc.” But seeing is believing. We measured the results, and anyone can see the difference in the amount of work we’re completing, and you can feel the difference in the positive attitudes around the office.”
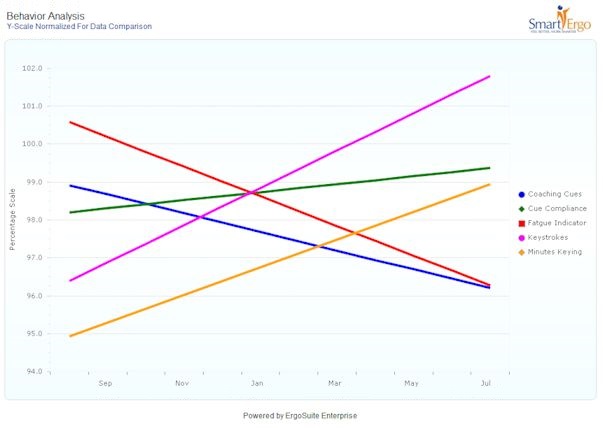
Below, we’re looking at an actual ErgoSuite Enterprise chart where we’ve chosen to utilize Least Squares Linear Regression Lines (trend lines) to reliably model extensive underlying data’s movement over time.
This chart summarizes a comprehensive twelve month research project completed last month, analyzing 595,260,706 keystrokes and mousing seconds belonging to a large population of knowledge workers including a diverse spectrum of job functions.
The live chart illustrates the achievable efficacy of Behavioral Office Ergonomics for reducing fatigue, increasing comfort, effecting actual behavior change and, yes, productivity improvement – which any organization of any size can sustainably realize.
When we properly empower employees, who can then meaningfully share in the responsibility of their comfort and safety and learn to automatically pace themselves while working in more neutral postures, then they will fatigue at a slower rate, be more comfortable, work at a lower risk profile, have fewer injuries and produce a higher output at a higher quality.

We’re data-driven people at SmartErgo and so in respect of the data and outstanding results, we’ll keep the commentary brief and simply report on the details here:
- A key understanding here (discussed in more detail below) is that the behavioral coaching cues are only required when an employee’s “recovery time as a function of duration and repetition” is inadequate (high risk). As they learn to automatically pace themselves then they are coached less by ErgoSuite Coach which knows this.
- We’re specifically examining (1) Behavioral Coaching Cues, (2) Cue Compliance which is a measure of an employee’s adherence with behavioral coaching cues supporting an organizational best practice, (3) Fatigue objectively quantified, (4) Keystrokes and (5) Minutes Keying.
- In this analysis, ErgoSuite is modeling actual data and not forecasting future trends.
- Of course, raw data is never as smooth as the trend lines because it ebbs and flows over time traversing seasonality such as reduced activity during holidays, however, the trends above are clear and reliable. Linear regression is an invaluable tool widely used throughout mathematics and business for modeling trends from complex data sets.
- Each metric in the chart is indexed to its initial value, for comparability, showing its trend (growth) over the period. For example, seeing the metric Fatigue decrease from an index of 100.5 down to 96.3 confirms that objectively quantified Fatigue has been reduced by 4.2% over the period after taking into consideration the entire ordered data set and not just the beginning and ending values. It does not mean that the employee population’s fatigue was over 100% at the start.
- The overall Behavioral Coaching Cue Compliance for this specific population of employees was solidly within the 90%-100% range throughout the period (see chart).
- The average number of data observations ‘per employee’ underlying ‘each’ trend line is more than 350,000 over the twelve month period.
- This employee population spans the spectrum of low, medium and higher computer-usage. In addition, we know from other collected live data analyses that when employees develop new good ergonomic behaviors at work, these learned behaviors carry on after work when using the computer at home.
- Work Output was up over the period from an index of 94.9 to 98.9 which is a 4 percent improvement over the twelve months for these new ErgoSuite users. We must be clear that an Output increase of 4% per year will not happen year to year every year as your employees are not robotic. It is, however, extremely well-received by clients to see Output move into a new zone and sustain there due to ErgoSuite use.
- Work Accuracy significantly improved over the twelve months we know because the Fatigue Indicator is a measure of how often employees adjust their own work. The less one’s work requires adjustment, the higher the quality achieved in fewer passes. In simple terms, employees become more accurate when they are comfortable and restful.
- Contemporaneous with the behavioral, fatigue and productivity improvements, employee work time edged up slightly (keying minutes) which was not only tolerable but also was expected as employees learned to more optimally work through pacing themselves effectively and working in more neutral postures, no different than how a marathon runner working in good form and pacing themselves can manage the full race and do it more comfortably and at lower risk. This is no different than how well can you work when you’re tired compared to when you’re fresh and rested.
Case Study – 404,266,869 Observations
Most people have heard the saying “a picture is worth a thousand words“. Well, here’s “a picture worth 404,266,869 keystrokes and mousing seconds”. This is an actual ErgoSuite data chart analyzing a year’s usage of ErgoSuite’s Employee Tools by a large population of knowledge workers:

What Does The Chart Depict?
- Let’s look into the chart and see what is happening through this actual data. We’re looking at an ErgoSuite Enterprise chart where we’ve chosen to view Trend Lines (Least Squares Linear Regression) which analyze actual underlying data. Used throughout data analysis and in mathematics, these lines represent the actual underlying data’s movement over time.
- Naturally, the underlying data is never as smooth as the trend lines because it ebbs and flows monthly traversing seasonality such as reduced activity during holidays, however, the trend is clear and reliable. Linear regression is an invaluable tool which is widely used for modeling trends from complex data sets.
- In this analysis, ErgoSuite is modeling actual data and not forecasting future trends. We’re specifically examining (1) Keystrokes, (2) Minutes Keying, (3) Minutes Mousing, (4) Coaching Cues from ErgoSuite and (5) Cue Compliance which is a measure of an employee’s adherence with coaching cues supporting an organizational best practice. These coaching cues are only required when an employee’s “recovery time as a function of duration and repetition” is inadequate (high risk).
- Each metric in the chart is indexed to its initial value, for comparability, showing its trend (growth) over the period. For example, seeing Cue Compliance grow from an index of 99 to 102.5 simply means its growth has been 3.5% from its initial monthly value and does not imply that compliance is above 100%.
- The average number of observations ‘per employee’ underlying each trend line is more than 192,000 over the twelve month period. The employee population spans the full spectrum of low, medium and higher computer-usage. We know we need to protect the full spectrum due to significant exposures outside of work which are at historic highs today. When employees develop new good ergonomic behaviors at work, they carry on after work when using the computer at home.
- In the chart, while output is increasing over the year, coaching cues are decreasing over the same time period. Here is solid evidence of new good ergonomic behaviors forming. Employees are not “being coached less because they are doing less”. In fact, they are producing more within a lower risk profile.
- The understanding key here is that employees learn to automatically take frequent short microbreaks while working to the extent that ErgoSuite recognizes this, thus reducing its need to provide coaching cues to meet the organizational best practice or standard.
